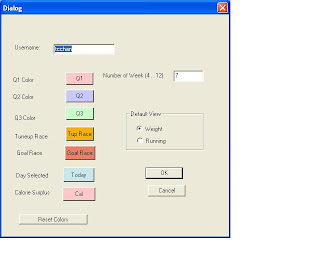
Once you install Ediary and run it for the first time, a setup window popup.
You should Add a User(Click the Add User Button and set your preference
Color and default view(either you start the program in running view or
Weight management view).
You also have to Set the Current User.
Noticed that You could add multiple users and to choose user, you just
Set the current user.
You can change the Data Directory to store your files if you want to.


(2)Once you successfully configure the options, a calendar view will appear.

Use the View Menu to choose weight management or running mode.
(3)You have to “double-click” on the day to enter data.
Once you double-click on a particular day, an entry form will appear.
Say you are now in running/exercise mode, then the below form will popup.

The plan section is for you to plan ahead your training, you could enter distance, proposed time of completion, Name and Descriptions of the run. Noticed that
The Name/Dist/Time will appear on the Calendar Cell, so use the name field
wisely.
The actual section is for you to log a run. The Name/Time/Distance will also
Appear in the calendar view. Also, once you enter distance and time, the software
Calculate your average speed(KM/H), pace(Min/K) and VDOT (from Jack Daniel,
Sort of like the Effort that you put in the run, the higher being the harder the effort)
Note that you could use the Descriptions field to write a race report too.
Various Descriptor can be set for the run, like Tempo, Hills , Interval, etc., which will set a marker on the calendar cell. In addition, the priority of the Run like Q1, Q2,Race, etc. will highlight the cell in different color(you could modify the colors in the Tools—Options Menu).
(4)The Summary column automatically calculate your weekly distance, pace, speed and Average VDOT. “Double click” on the Summary cell, a separate form will
appear for you to enter your weekly data.

(5) On Tools—Report Menu, you could graph your running data, two plot is provided
for you to trace correlation between the parameters. “Right click” on the graph and click properties to choose the setting of the plots.
The moving average is used to smooth the data.


(6)The weight management mode is like the running mode, you double-click on the
day to enter data.


Weight yourself at the same time( morning after bathroom visit?) to collect the daily weight. You also have to be quite familiar with food calorie estimation to make it useful. Basically you enter your daily calorie(food) intake and estimate your calorie expenses (your Basal Metabolism rate + any activity that you do).
Check the web to gather all these data.
The nice thing is when your intake is greater than your expenses, the cell is marked pink to alert you.
You could enter your strength training routine too. Use the tools—options menu to add any additional exercises
(7)The summary column let you enter you plan weight and your weekly average weight is calculated and compare to the planned weight and alert you in red is exceeded.

(8)The report is similar to that of running, and you right click to select the plot.


No comments:
Post a Comment